
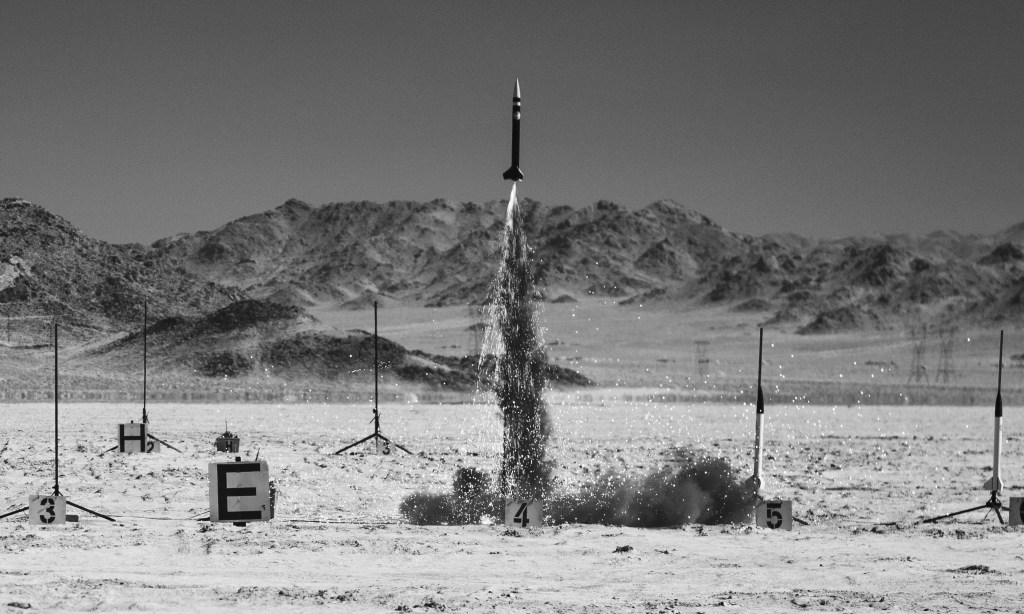
So first things first, we all passed our high-power rocketry certification! Which is awesome, but here’s the thing: our Pleiades 1 rockets didn’t fly quite as high as we expected. In fact, they achieved a maximum altitude about 31% shorter than what was predicted.
We spent a lot of time running simulations before launch to nail down our motor choice and make sure everything would be safe with our Zephyr kit. RockSim Pro 4, the software we used, did what it was supposed to do. But when we actually launched the rocket, something didn’t add up. So this article is the start of us digging into why our rocket didn’t climb as high as the numbers said it should.
In all honesty, we’re not totally sure what caused it yet. But we’ve got some interesting data, plus an awesome photo taken during the descent, that’s helping us figure it out. So stick around to see what we think went wrong and do some science!
To start, you will see our data with the simulation results compared to the actual data plus the percent difference between the two here:
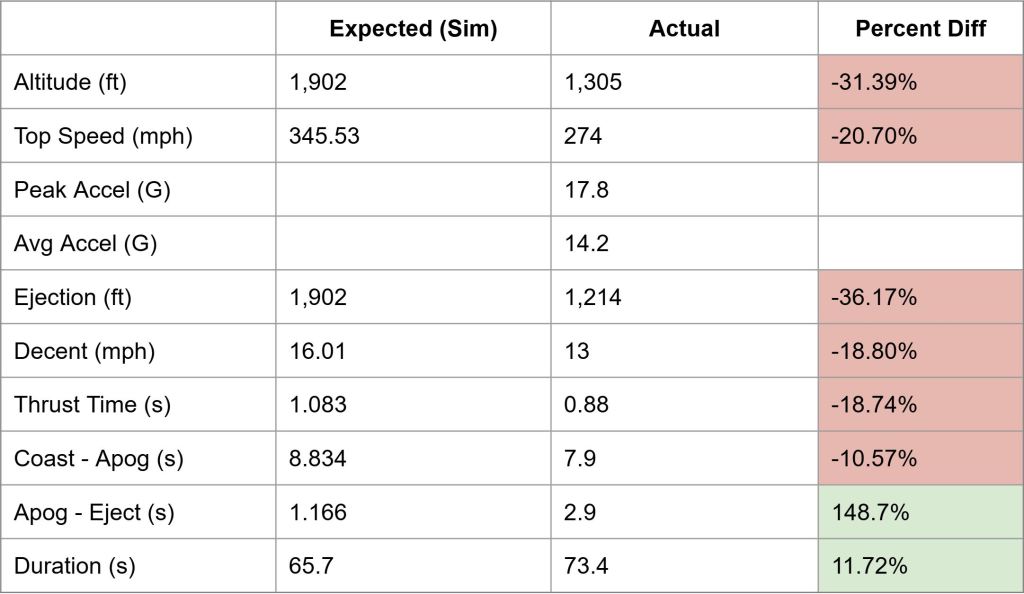
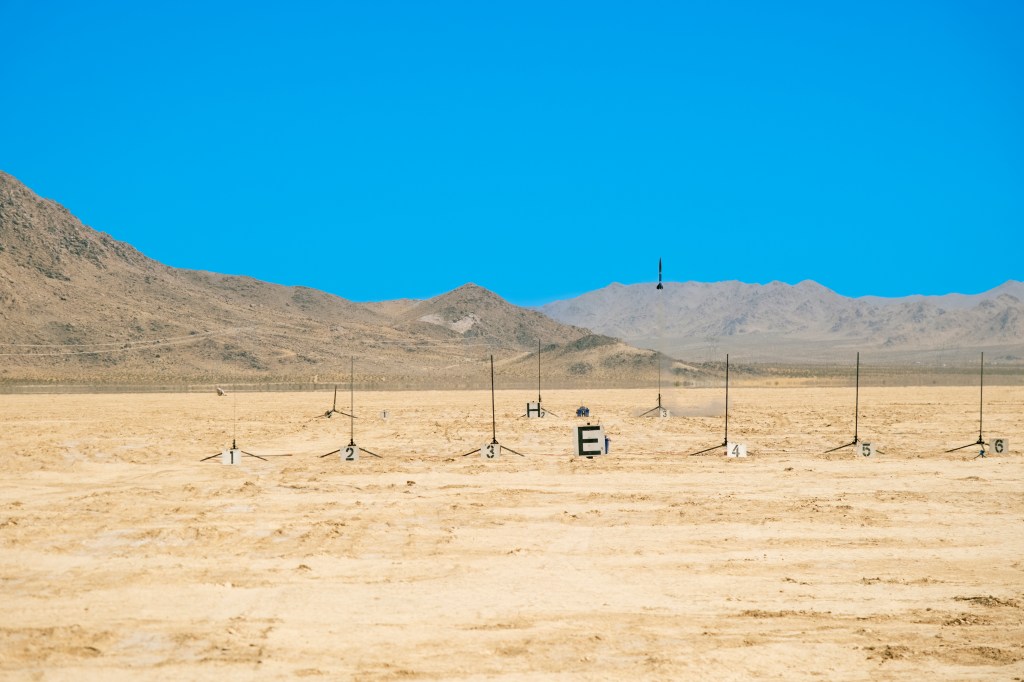
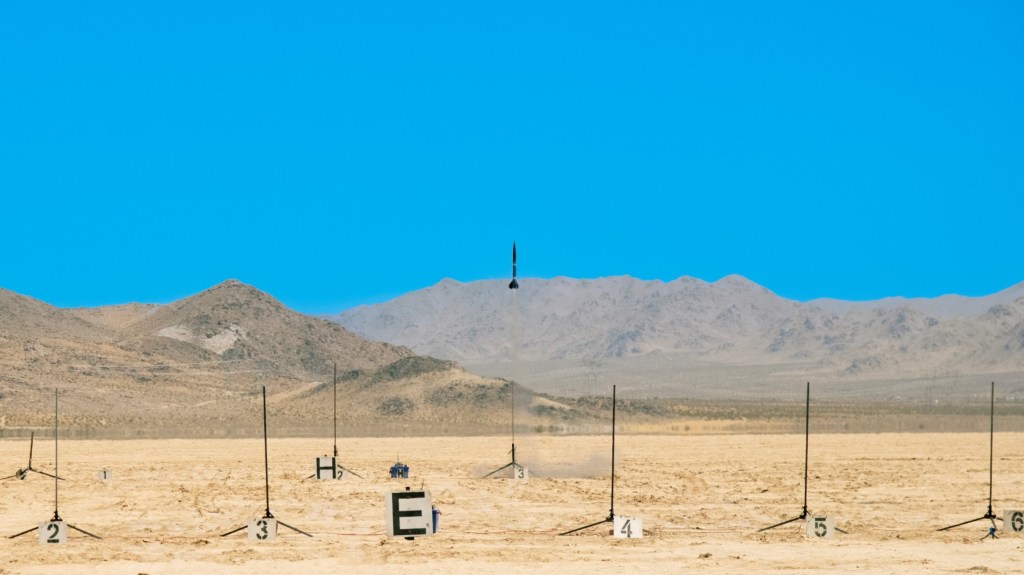
For our launch and for these simulations we used the H219T-14 motor but with the delay changed to approximately 10 seconds instead of 14 seconds. The Zephyr model used in RockSim was pulled from the Apogee Rockets site here. Finally, the launch conditions at the launch site (Lucerne Valley, CA) simulated are found here plus wind:
- Altitude: 2952.99869 Ft.
- Landing zone altitude: 2952.99869 Ft.
- Relative humidity: 20.000 %
- Temperature: 95.000 Deg. F
- Pressure: 29.9730 In.
- Launch guide elevation: 0.000 Degrees from vertical
- Launch guide azimuth: 0.000 Degrees
- Longitude: -116.967 Degrees
- Latitude: 34.517 Degrees
- Winds: 15 MPH from 70 Deg.
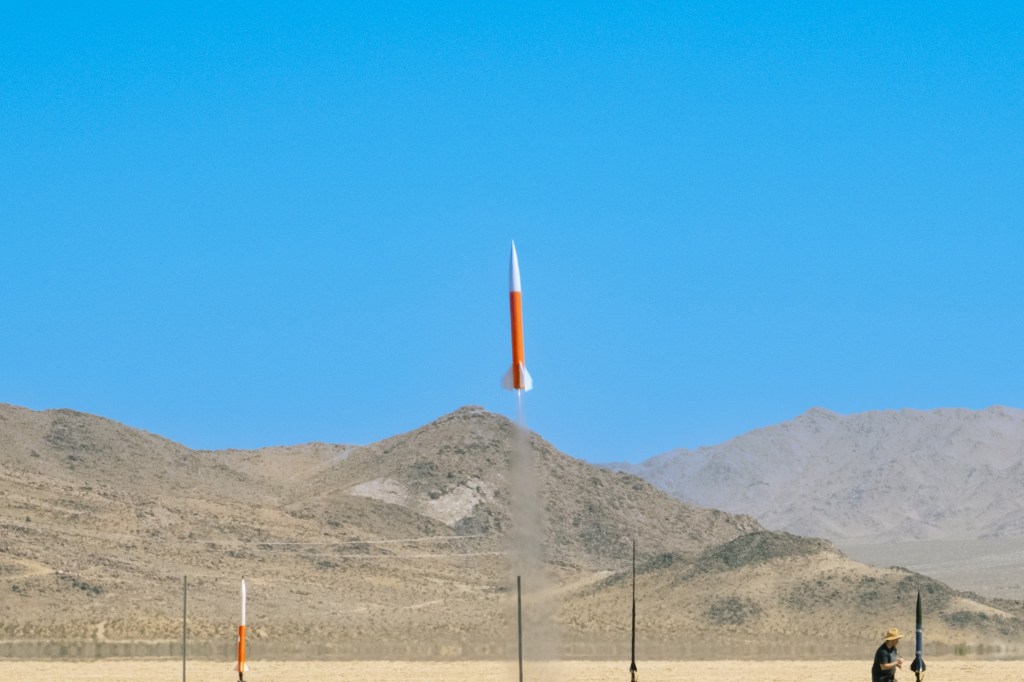
Even though we passed, something interesting must have happened somewhere for our max altitude (apogee) to be 31% lower than expected. So what causes this difference? In all honesty, we are not sure yet. But thanks to Marvin at The Talkative Photographer, we have this image of Sarah’s recovery system soon after deployment. How soon? Unfortunately, we do not know. (Note that for future missions). This image will help us gauge if the altimeter was roughly accurate or not and thus help us start our investigation.
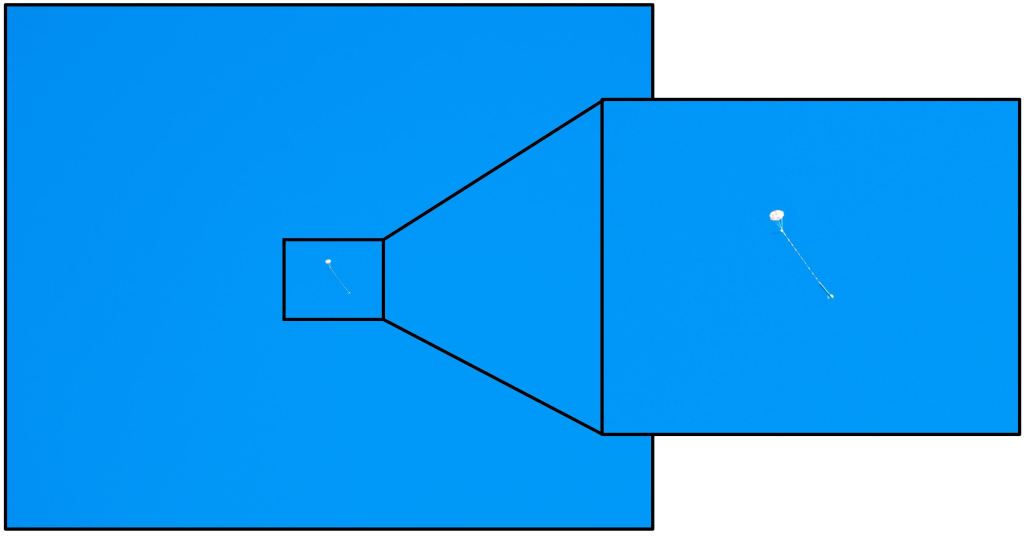
The original image has a resolution of 7728 x 5152 with a focal length of 80mm and full-frame sensor at 36mm. Sarah’s rocket body, minus the cone, is about 50 pixels long here and in reality is 36 inches tall. We can use this formula to find how far the camera was from the rocket.
Where D is the distance to rocket (mm), f is focal length (mm), H is real object height (mm), and p is the pixel size on sensor mm/pixel.
With that we get a distance of 1,030 feet, but that is the hypotenuse so let us break out our geometry! Here we also do not know the exact distance of where the rocket was on a horizontal plane, so on the x axis. However, we assume somewhere between 100 feet and 250 feet (image below).
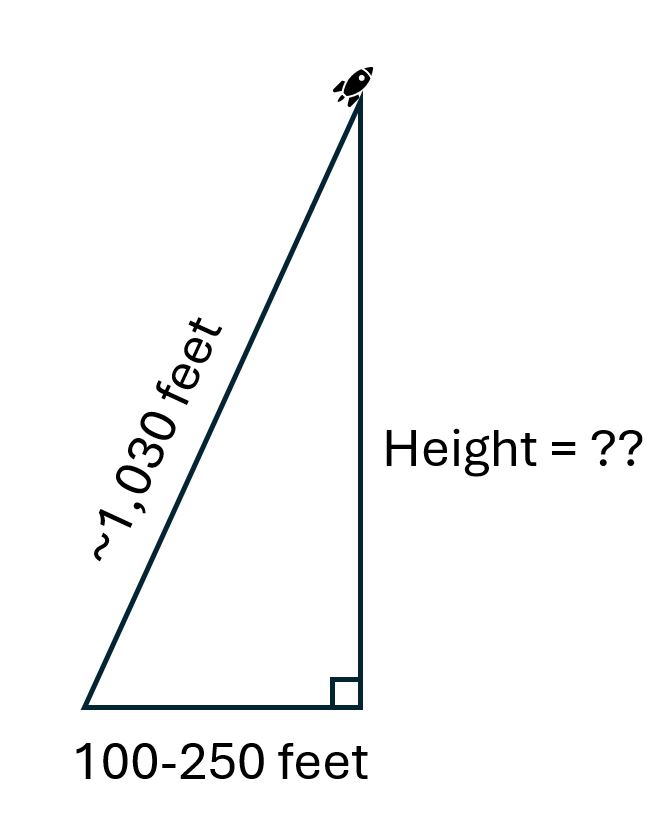
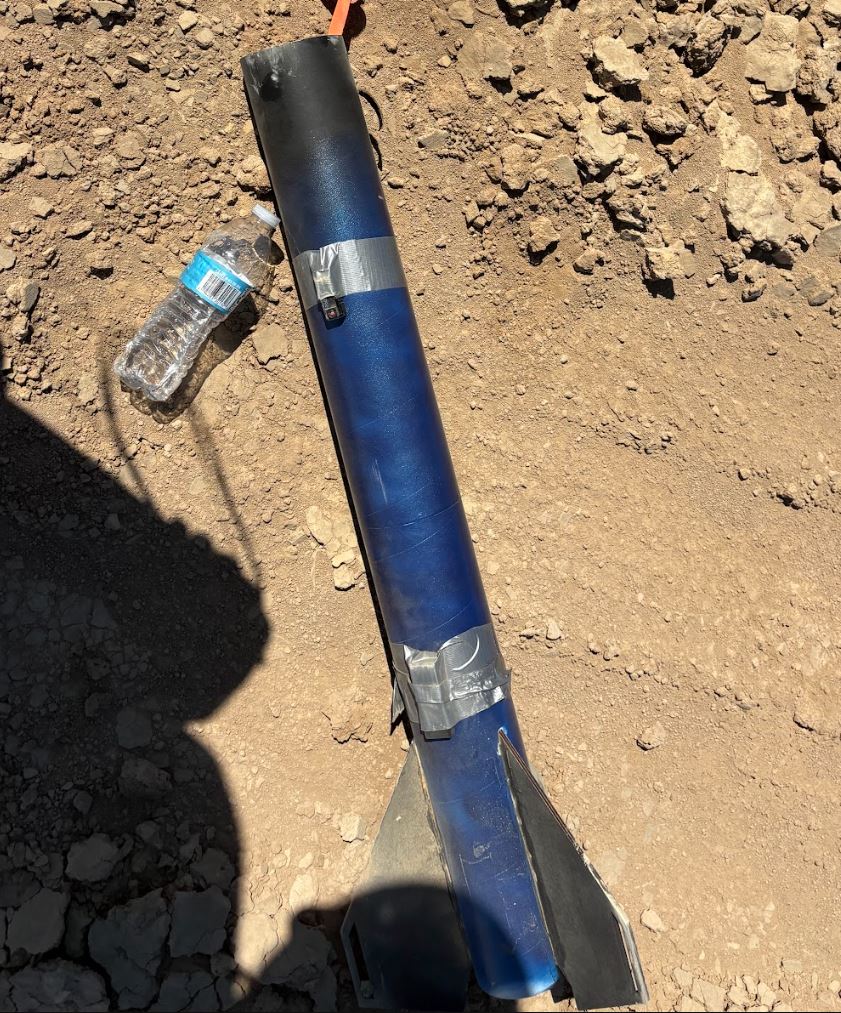
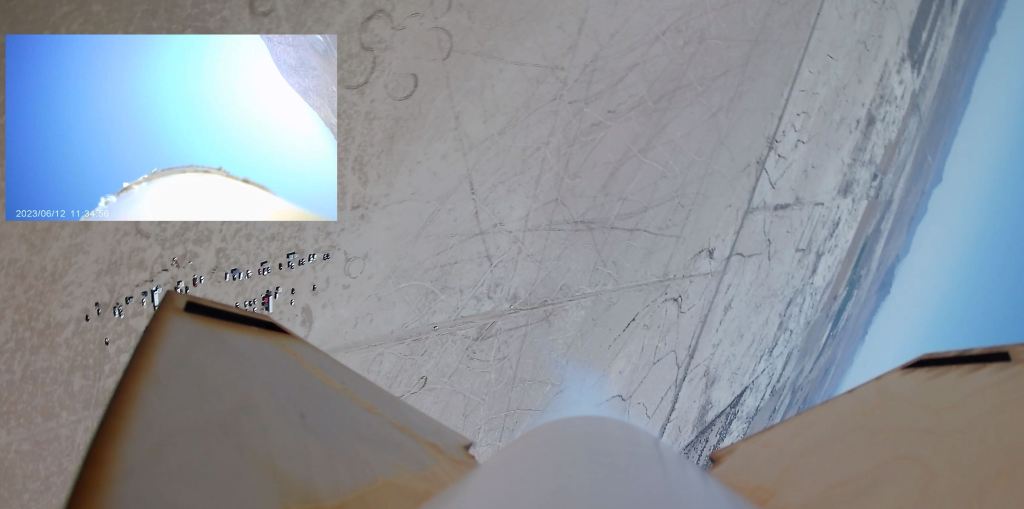
This results in a vertical distance of about 999.20-1,025.13 feet. Though this is not the apogee it does roughly confirm that the altimeter was working as intended. After all, these estimates are not too far off of the ejection altitude of 1,214 reported by the altimeter. So this means the Jolly Logic Two altimeter likely worked despite being duct taped to the rocket as seen here.
So in the end, we are not really sure why our rockets flew lower than expected, more testing is needed either with more launches or getting better at RockSim. With that being said, here are some of our hypothesis as to what causes the rockets lower performance:
- Higher than expected winds at altitude compared to our simulated winds.
- Motor performed less powerfully than expected.
- Altimeter was mounted poorly/incorrectly to the rocket.
- We lost performance due to the rocket spinning, as seen in the video at the end.
As all good scientists should, we should discuss our thoughts with the data for all to see. So what do you think caused this loss in performance and how shall we test your hypothesis? Comment below and we may just test your hypothesis!
One response to “Pass, But At What Height? We Passed Our Certification, But Why Did Pleiades 1 Fly Lower?”
-

[…] Pass, But At What Height? We Passed Our Certification, But Why Did Pleiades 1 Fly Lower? […]
LikeLike



Leave a Reply